
PTE Describe Image template for 12 image types
A sentence plan for each of the 12 image types, from line graphs to photos, with the linking words to join them.

By Thanh Tran, PTE and IELTS coach
Updated

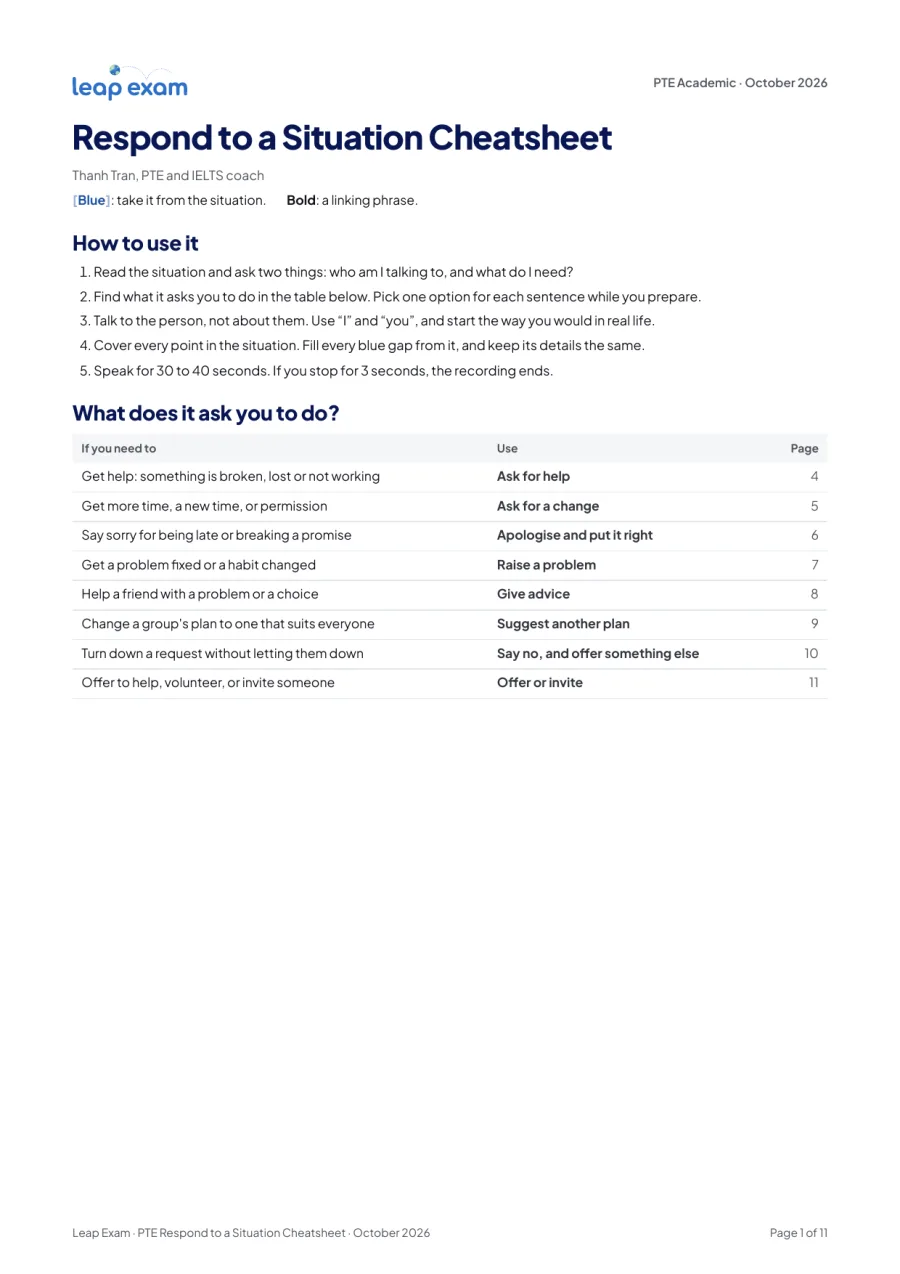
Which image is it?
The cheat sheet has a page for each of the 12 kinds of image. Find yours here, then turn to its page.
- Page 4
Line graph
Lines that go up and down over time
- Page 5
Bar chart
Bars side by side, in groups or stacked
- Page 6
Pie chart
A circle cut into slices
- Page 7
Table
Rows and columns of numbers
- Page 8
Two charts together
Two charts, or bars with a line on top
- Page 9
Map of countries
A world or country map with a colour key
- Page 10
Map of a place or floor plan
A town, an island, a building or the rooms of a home
- Page 11
Process or flow chart
Boxes or pictures joined by arrows
- Page 12
Natural cycle
Arrows in a circle: an animal, a plant, water
- Page 13
Labelled diagram
One object, building or living thing with labels on its parts
- Page 14
Pyramid or ranking
A triangle in levels, or jobs from the top down
- Page 15
Photo or picture
A photo or drawing with no numbers
How to use it
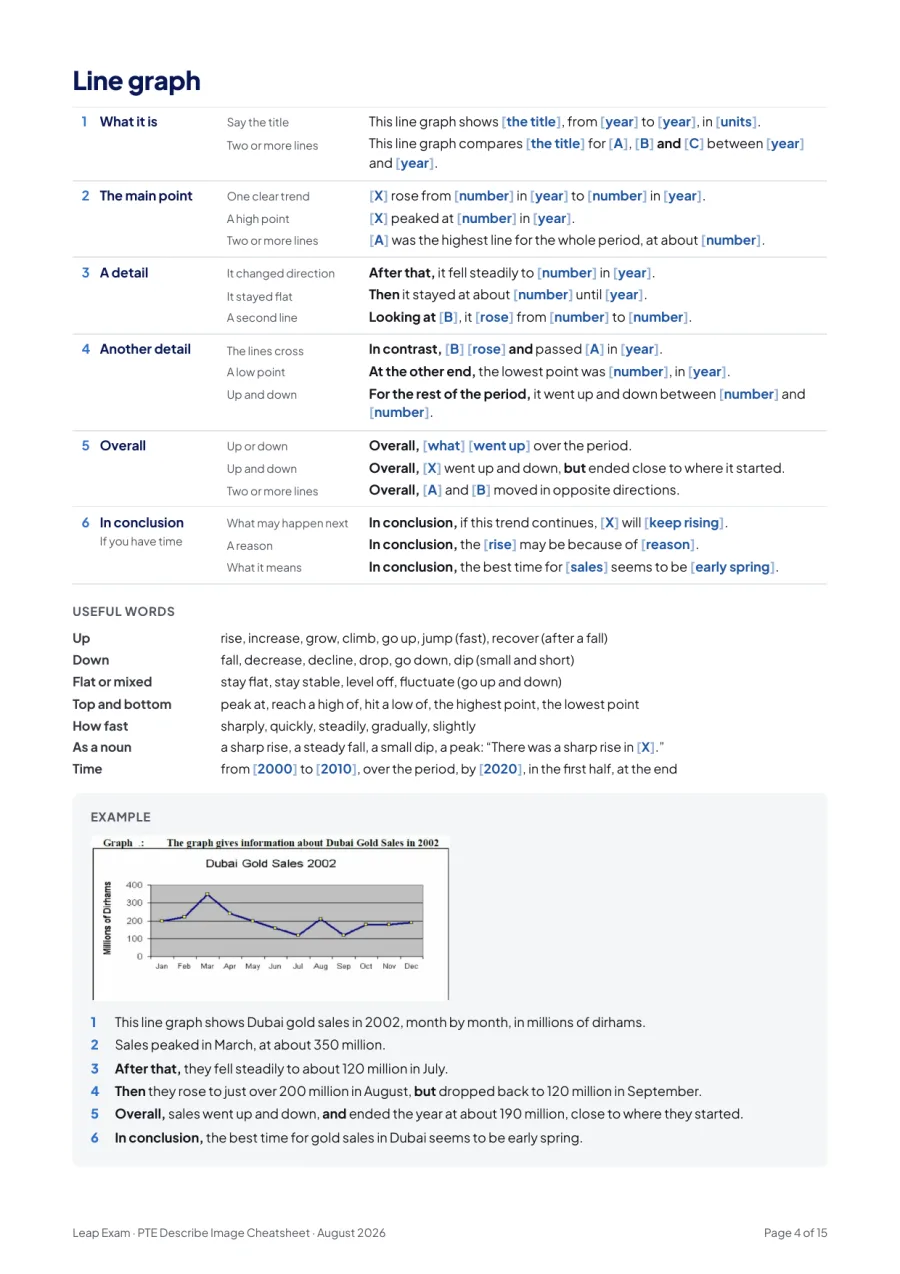
Find your image type. While you look at the image, pick one option for each sentence.
Sentence 1: say the title, plus the years and units. No title? Say what it shows.
Fill every blue gap from the image. If you can't, pick another option.
Can't read a number exactly? Round it and say “about”.
Keep talking. If you stop for 3 seconds, the recording ends.
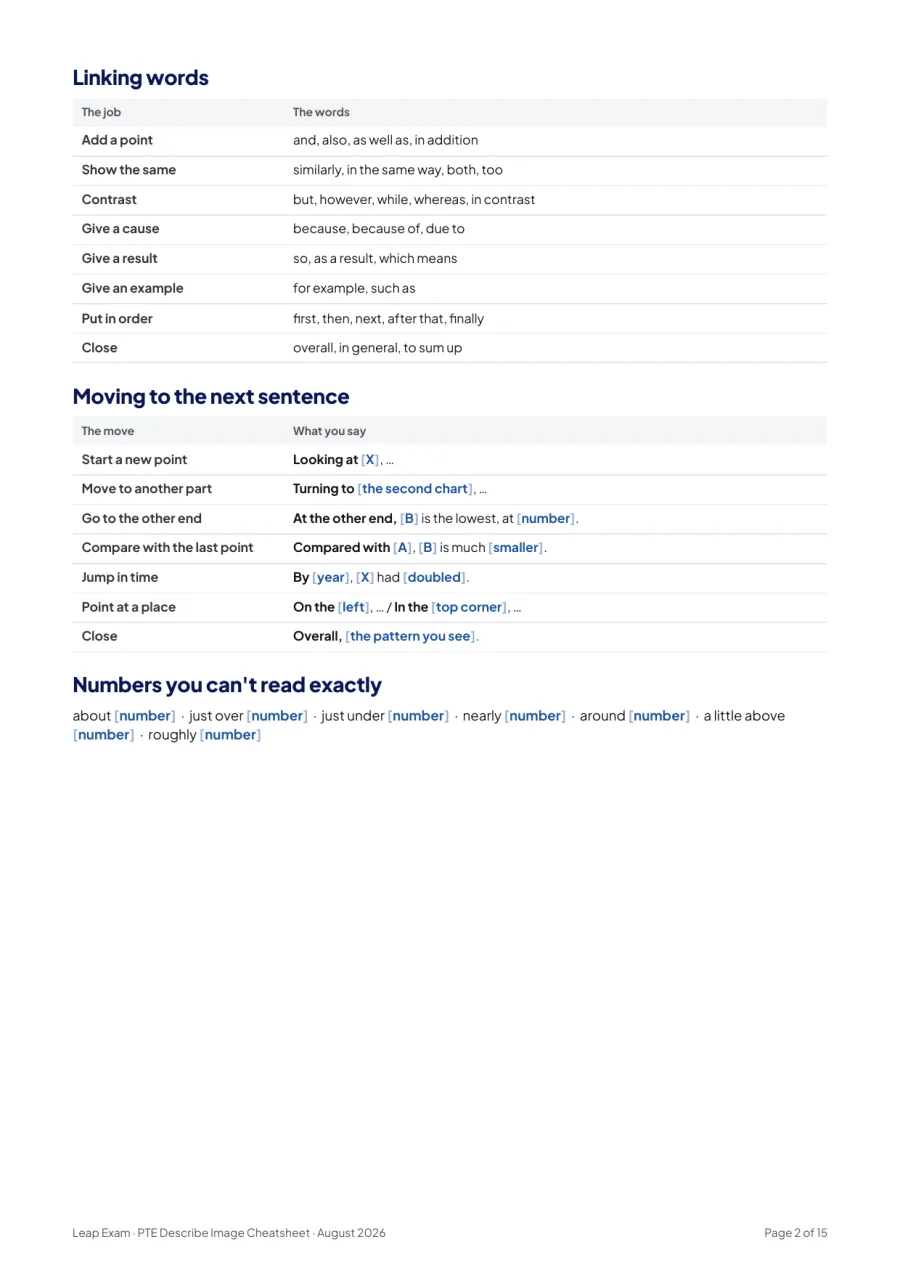
The line graph template
Page 4 of the cheat sheet, as it prints. Pick one option for each sentence and fill the blue gaps.
Blue: take it from the image.Bold: a linking phrase.
- What it is
- Say the titleThis line graph shows the title, from year to year, in units.
- Two or more linesThis line graph compares the title for A, B and C between year and year.
- The main point
- One clear trendX rose from number in year to number in year.
- A high pointX peaked at number in year.
- Two or more linesA was the highest line for the whole period, at about number.
- A detail
- It changed directionAfter that, it fell steadily to number in year.
- It stayed flatThen it stayed at about number until year.
- A second lineLooking at B, it rose from number to number.
- Another detail
- The lines crossIn contrast, B rose and passed A in year.
- A low pointAt the other end, the lowest point was number, in year.
- Up and downFor the rest of the period, it went up and down between number and number.
- Overall
- Up or downOverall, what went up over the period.
- Up and downOverall, X went up and down, but ended close to where it started.
- Two or more linesOverall, A and B moved in opposite directions.
- In conclusionIf you have time
- What may happen nextIn conclusion, if this trend continues, X will keep rising.
- A reasonIn conclusion, the rise may be because of reason.
- What it meansIn conclusion, the best time for sales seems to be early spring.
- This line graph shows Dubai gold sales in 2002, month by month, in millions of dirhams.
- Sales peaked in March, at about 350 million.
- After that, they fell steadily to about 120 million in July.
- Then they rose to just over 200 million in August, but dropped back to 120 million in September.
- Overall, sales went up and down, and ended the year at about 190 million, close to where they started.
- In conclusion, the best time for gold sales in Dubai seems to be early spring.

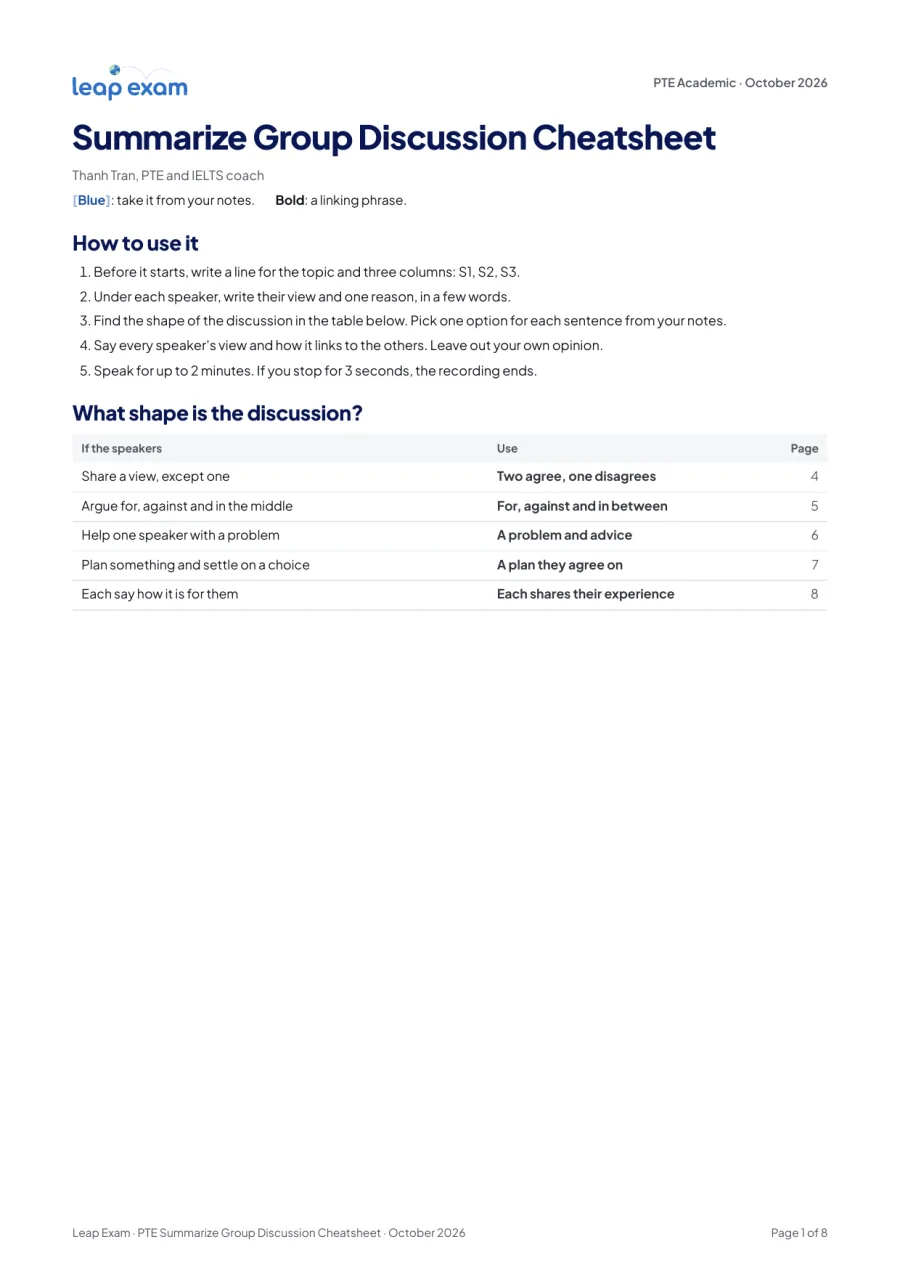
常见问题
Are templates allowed in PTE Describe Image?
Which image types does the cheat sheet cover?
How do I use it in the 25 seconds?
How long should I speak in Describe Image?
Is the PDF free?
免费获取 Describe Image template